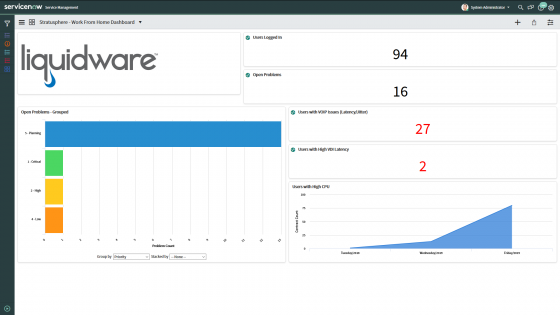
This is an example Work from Home Dashboard using just a few of the metrics from Stratusphere UX. Example metrics shown include Users Logged In, Users with VoIP Issues (Latency/Jitter), Users with High VDI Latency, and Users with High CPU Utilization . More complex dashboards are easily defined for specific user groups and business units – the data and uses cases are virtually unlimited.
ServiceNow Screenshots
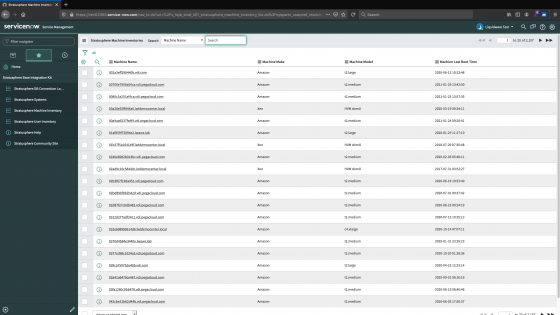
Machine Management
As a part of the “Stratusphere Base Integration Kit,” machine inventory is pulled into ServiceNow into a separate table space from the primary CMDB. This data can then be used to augment the existing CMDB with metrics such as last boot time or resolution of the monitor(s) plugged into the machine. Stratusphere UX Machine Inventory data provides comprehensive information about the desktop estate including age, maker, model, SN CPU, Memory, disk and many more details about the entire range of machines being deployed throughout the enterprise.
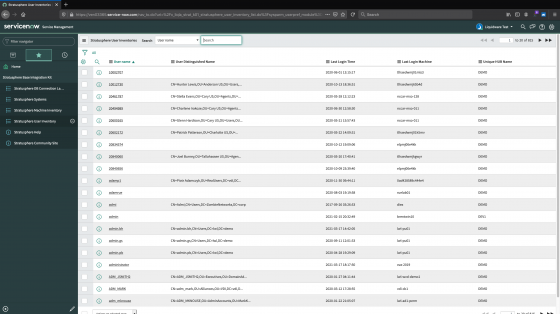
User Management
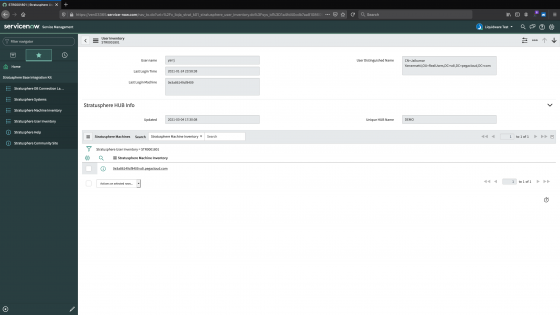
User inventory data is pulled into ServiceNow into a separate table space from the primary CMDB. This allows admins to look for specific users in a friendly intuitive way and then be able to drill down into more details about their workspaces including machine information.
User Details
Stratusphere Systems
Management of Stratusphere Server Connections is done in the ServiceNow interface. This interface shows the Stratusphere UX system name, MID Server name, and connectivity status of both. This interface can be used by the administrator to define Stratusphere Connections and put them into “Maintenance Mode” when updates are required.
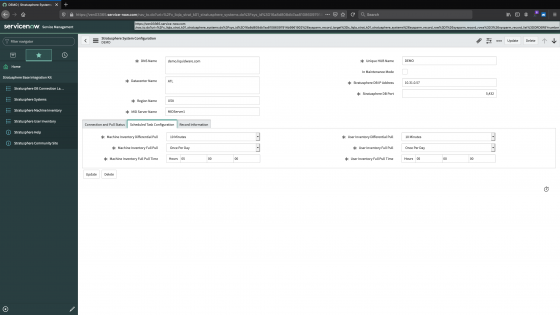
System Details
Clicking on a server allows the admin to bring up details about the server including the settings for Scheduled Tasks.
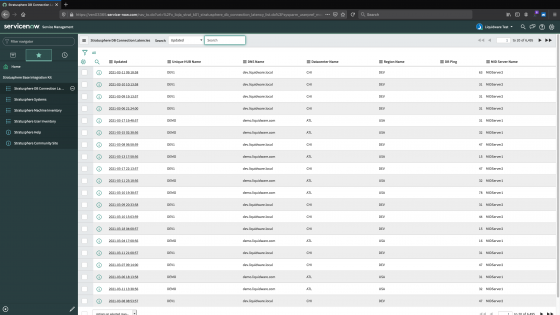
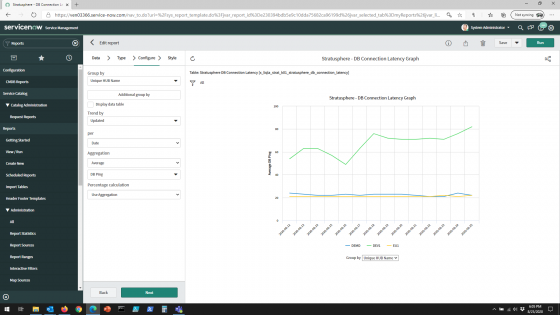
DB Connection Latency
The Stratusphere DB Connection Latency report helps to monitor the health of the connection from ServiceNow to the Stratusphere UX Database. This report plots DB Connection latency over time and is important to monitor for fast user interaction/updates of data.

