Power BI

StratusphereUX PowerBI

Join Two Solutions for the Ultimate in Data Visualization

Microsoft Power BI is a business analytics service by Microsoft. It aims to provide interactive visualizations and business intelligence capabilities with an interface simple enough for end users to create their own reports and dashboards.

Liquidware’s Stratusphere UX  end user experience monitoring solution displays one of the most extensive and complete data sets on the market encompassing all facets of the workspace environment.

When you import Stratusphere UX data into Power BI, you gain the ultimate in business intelligence visualization for digital workspaces providing powerful support for IT decision making.

Stratusphere UX API builder enables a simple process for extracting its data in either JSON or CSV formats.  These standard formats can be easily dropped into PowerBI, with a minimum of editing or revisions.   Then data fields can be combined in numerous ways for representation in PowerBI’s extensive array of charts and  graphs, allowing you to perform  nuanced analytics to obtain  answers to your most strategic and critical questions.

Power BI Dashboards

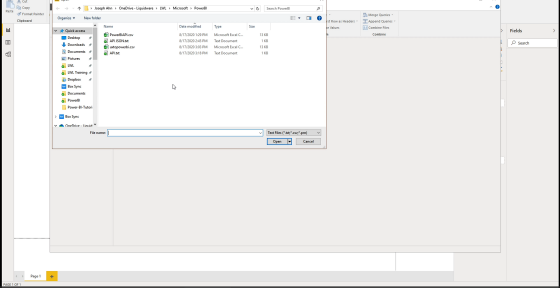
API Csv Output

The Stratusphere UX API Builder can output the comprehensive end-user computing data contained in Stratusphere UX in two standard formats.   The CSV format allows you to easily export data and utilize it seamlessly in Excel or PowerBI software for the utimate in analysis and business intelligence visualization.

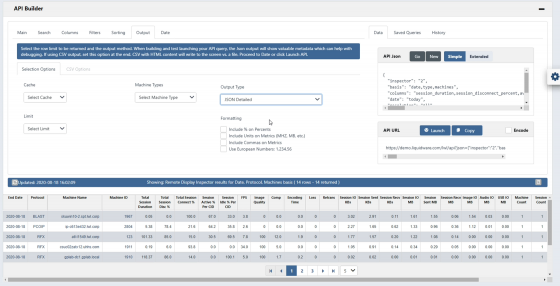
API Json Output

The Stratusphere UX API Builder can provide data output from the solution in the JSON format standard as well as CSV, allowing you to use whichever standard would be preferred for the task at hand.  The JSON standard can be utilized within PowerBI with only minor adjustments and revisions to the content, allowing you to customize data fields as required.

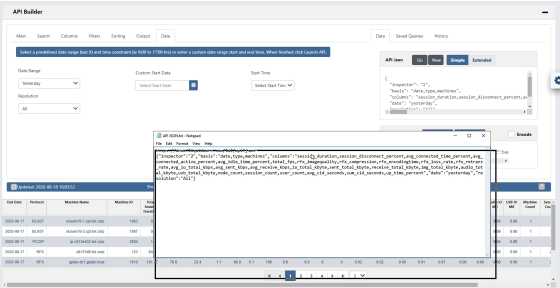
API Ouery String

The Stratusphere UX API Builder allows you to select the data you want to focus on, presenting it in a bar across the bottom to ensure that it is correct.   Once you select the Output tab, the API Builder automatically creates a query string that can be copied and imported into PowerBI.  Once the data has been imported, you can model it in sophisticated ways to gain the insights into the performance of your workspace environment, supporting decision making for change, growth and optimization.

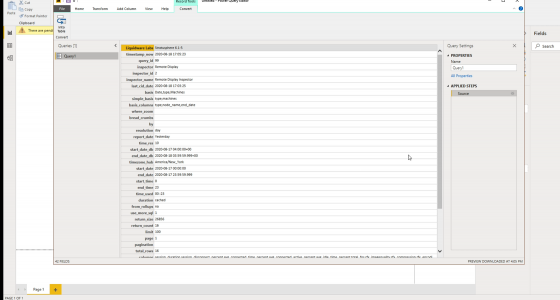
Power BI Insert Query

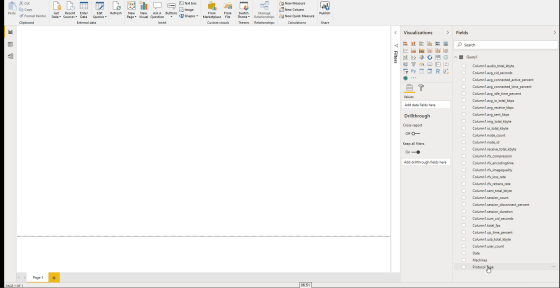
After the Stratusphere UX data is imported, Power BI offers an easy-to-follow interface allowing you to customize fields and the data as needed for your own specific business intelligence requirements.

Power BI View Columns

Once Stratusphere UX data is imported into Power BI, you can easily adjust it in order to customize data fields or to represent rows and columns as needed.  Stratusphere UX data is identified with friendly, descriptive names and simple intuitive formats so utilizing it within PowerBI is straightforward and seamless.

Power BI Visualization

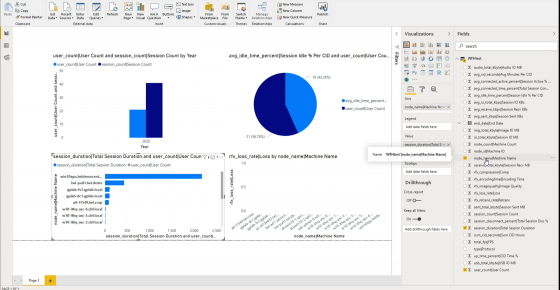
Once Stratusphere UX data is imported into Power BI, you are equipped to take advantage of the wide range of visualization graphics within the tool, including charts, scatterplots, tables, maps, slicers, KPIs and more.  These compelling visuals allow you to  identify patterns, find errors and  grasp the latest trends, thus allowing you to  take quicker remedial action or make enhancements as needed.